HDJ is an Eclipse plugin that takes advantage of the debugging capabilities already implemented in Eclipse (i.e., HDJ uses the Eclipse's trace debugger), and it adapts the already existent Declarative Debugger for Java (DDJ) to the Eclipse workbench.
One of the debuggers, the trace debugger, was already implemented by an Eclipse plugin called JDT Debug.
The other two debuggers have been implemented in the HDJ plugin.
The tool allows the programmer to switch between three perspectives:
- Debug
- This perspective allows us to perform Trace Debugging. It is the standard perspective of Eclipse for debugging. It is composed of several views and editors and it offers a wide functionality that includes conditional breakpoints, exception breakpoints, watch points, etc.
- ODJ
- This perspective allows us to perform Omniscient Debugging. It contains the same views and editors that form the standard debug perspective. Therefore, although the programmer is using a different debugger with a totally different debugging mechanism, their GUI is exactly the same; and thus, the internal differences are transparent for her. The only difference is that ODJ allows us to explore the execution backwards. Internally, it uses a trace of the execution that is stored in a database.
- DDJ
- A complete description of DDJ can be found here.
One of the important challenges when integrating two new debuggers into Eclipse was to allow all of them to debug the same program together (i.e., giving the programmer the freedom to change from one debugger to the other in the same debugging session). For this, all of them must have access to the same target source code (e.g., a breakpoint in the target source code should be shared by the debuggers), and use the same target Java Virtual Machine (JVM) and the same execution control over this target JVM. The Java Virtual Machine Tools Interface (JVM TI) provides both a way to inspect the state and to control the execution running in the target JVM. The debuggers access it through the Java Debug Interface (JDI) whose communication is ruled by the Java Debug Wire Protocol (JDWP). This small architecture to control the JVM is called Java Platform Debugger Architecture (JPDA).
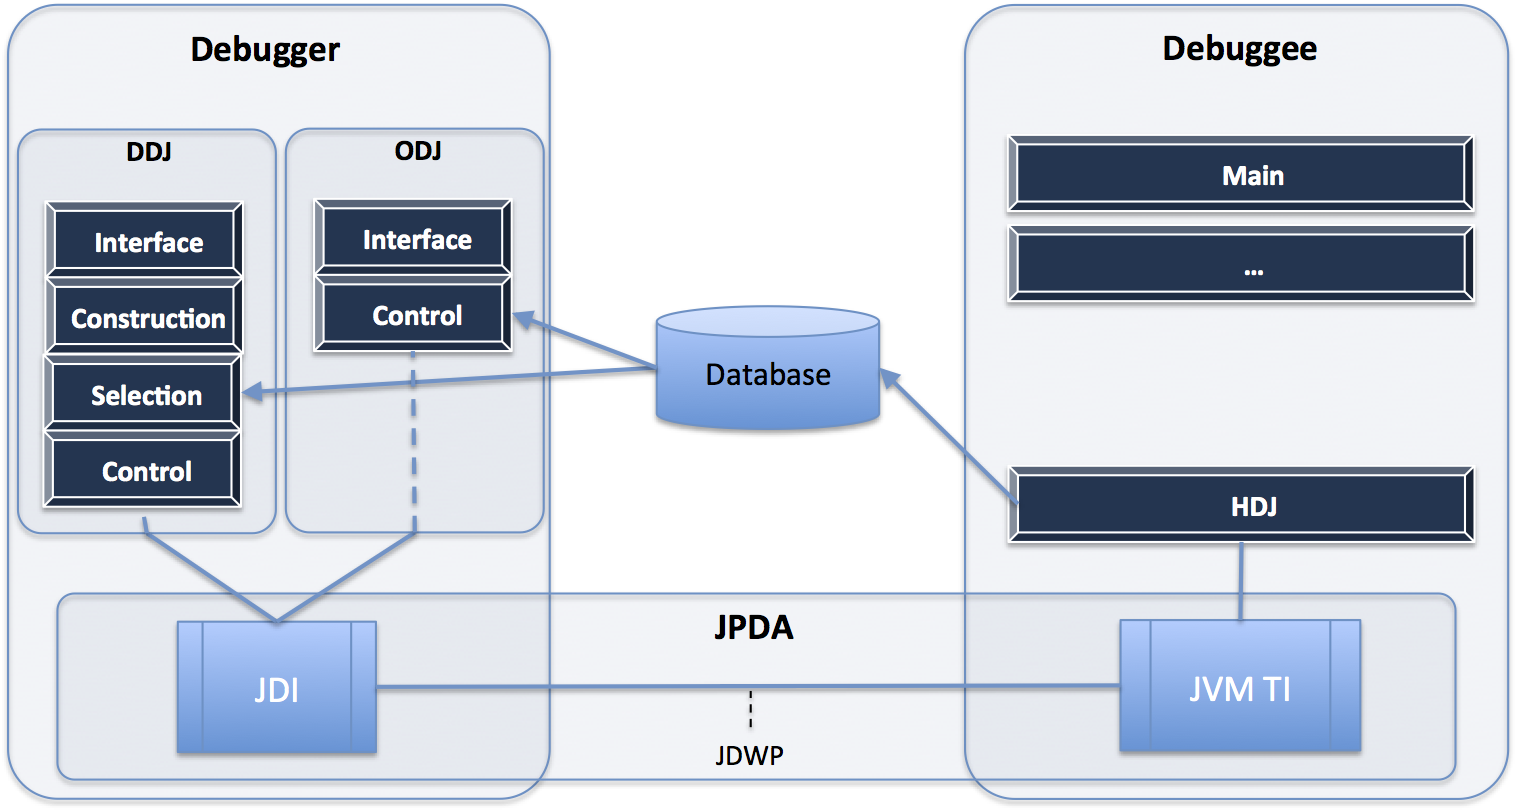
The integration of HDJ into Eclipse implies having three different debuggers accessing and controlling the same JVM where the debuggee is being executed. Therefore, our architecture uses two different JVMs that run in parallel and communicate via JPDA. The first JVM is where the debuggee is executed. The second JVM is where the debuggers are executed. It is important to remark that the information of one JVM cannot be directly accessed by the other JVM. Controlling one JVM from the other must be done through JPDA. The next figure summarizes the internal architecture of the debugger to control the execution of the debuggee.

The big boxes represent two JVMs. One for the debugger, and one for the debuggee. The debugger has two independent modules that can be executed in parallel: The algorithmic debugger DDJ, and the omniscient debugger ODJ. Each dark box represents a thread. DDJ has four threads: interface to control the GUI, construction to build the ET, control to control and communicate with the debuggee JVM, and selection to select the next question. ODJ has two threads: interface and control that perform similar tasks as in DDJ. In the debuggee, a new thread is executed in parallel with the program. This thread, called HDJ, is in charge of collecting all debugging information and storing it in a database. This information is later retrieved by threads control. Thread HDJ makes this approach scalable, because it allows to retrieve all the necessary information with a very reduced set of JPDA connections. In the case of Omniscient Debugging, the information stored in the database by thread HDJ contains all changes of variable values occurred during the execution of the method being debugged.