Multiple roots
An example
The polynomial  has a double root in
  Multiple roots cause numerical unstability. It is interesting to graphically analize the behavior of a polynomial near its multiple roots.
Define this polynomial in the applet by entering its coefficients in the Algebra panel or by dragging the corresponding points in the Graphics panel to:


The simple root
Set now  and
and  and adjust the scale with the mouse wheel. The image curve loops the origin three times.
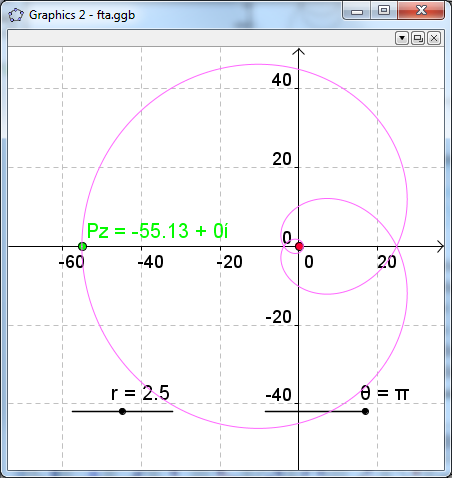
Figure 1: Image of the circle with
Decrease slowly the value of  using the corresponding slider in the image window. Zoom in to observe the first crossing of the image curve through the origin.
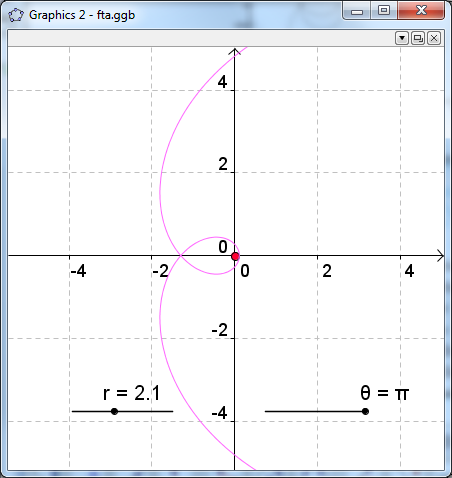
Figure 2: The origin is about to exit the inner loop for  .
.
Between and  the origin goes out of the inner loop of the image curve. The crossing corresponds to the root
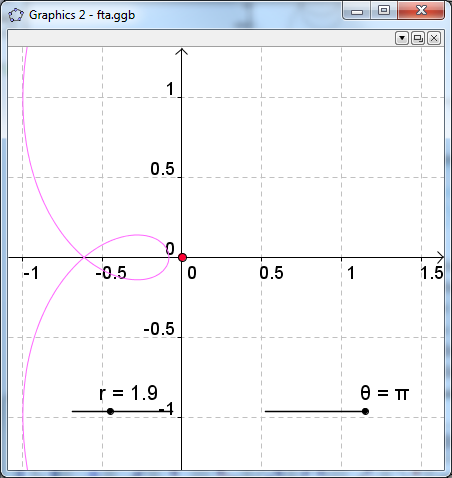
Figure 3: The origin is outside the inner loop for .
Reducing further the value of r, the inner loop shrinks and, about  , it disappears. The image curve still performs two loops around the origin. A big one and a smaller one.
The double root
Let us now consider values of r near 1, that is the modulus of the double root of the polynomial. The small loop gets smaller when r continues decreasing.
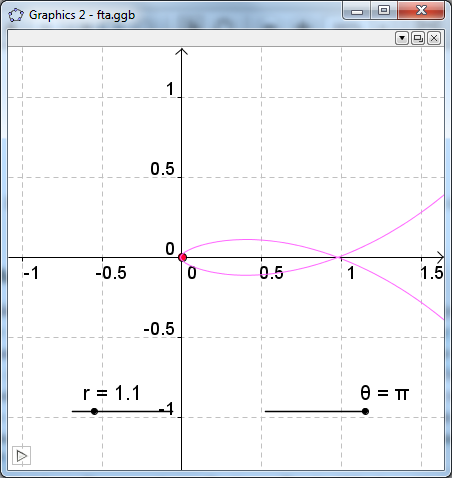
Figure 4: For  , the origin is still inside two loops.
Near  the inner loop vanishes and, at the same time, the origin exits the whole curve. This strange crossing corresponds to a double root.
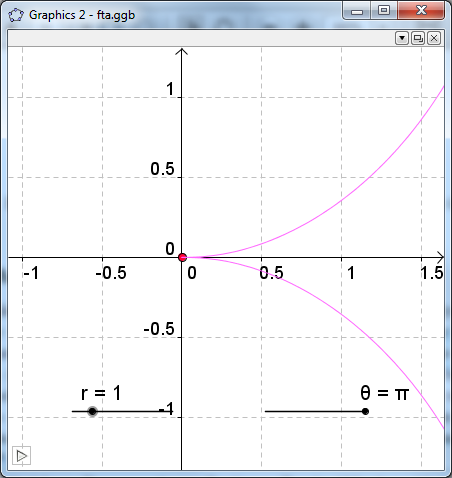
Figure 5: For , the origin touches the image curve in a singular point, that corresponds to a double root.
For values of r smaller than 1, the image curve does not contain the origin.
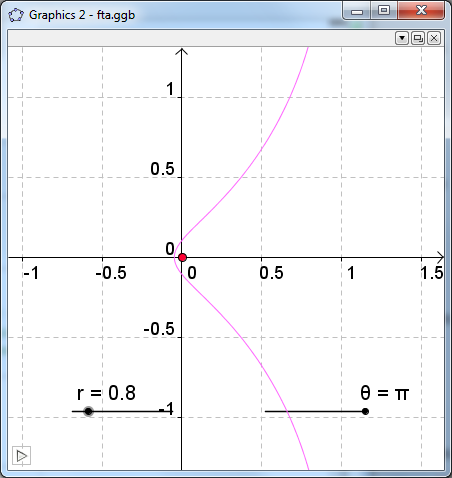
Figure 6: For  the origin is clearly outside the curve.
Creating a movie.
Right click on the r slider and select Object properties.
In the tab Slider set the Interval parameters Min: 0.5, and Max:1.5 and the other parameters as seen in the figure.
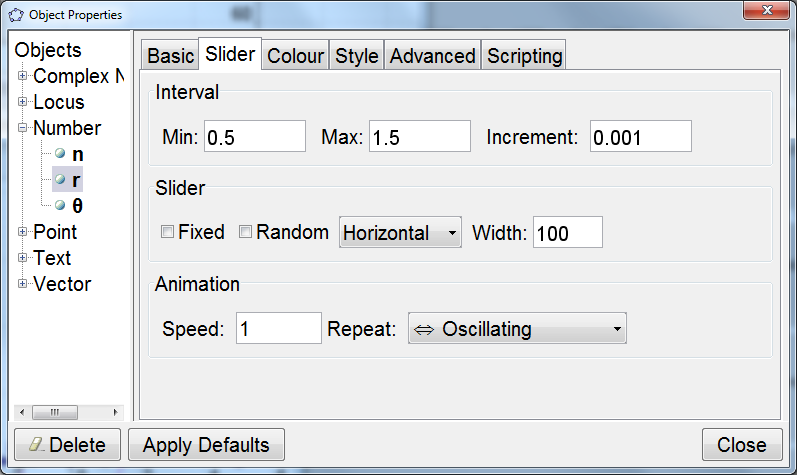
In the tab Basic check the box Animation On.
Close the window Object properties and observe the evolutions of the curve. Adjust the zoom to change the region of interest.
Exercise
Animate the curve for values of the modulus between 1.8 and 2.2