The main data collected in the experiment are the students' attendances along several courses.
For each student, we collected the exact chair (identified with the row and column) where they sat in each session.
Moreover, at least one official
exam was registered for each course. We combined the final marks with the other
available data to generate a number of reports with statistics and other calculations
that are the basis of more advanced statistics shown in pages
results and
further statical analysis.
One of
the biggest challenges was to obtain statistics not related to individual students but,
on the contrary, associated with the different physical positions that can be occupied
inside classrooms. To achieve this goal, we designed the experiment in a novel way:
we collected the data linked to each
individual chair of each classroom instead of analyzing the students. Therefore, the
data linked to each chair have been produced by combining the data collected every
time a student (not necessarily the same one) sat in this particular chair. All data were
later combined to produce extrapolative results. The collected data are the
following:
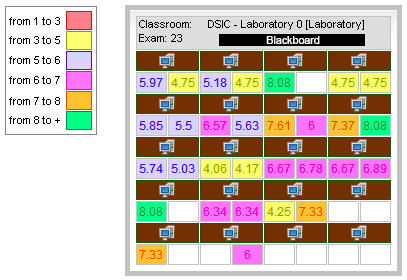
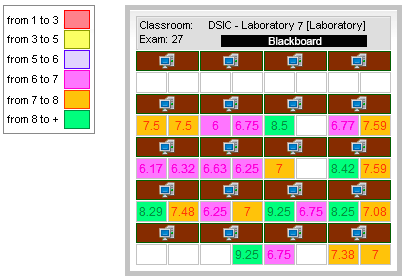
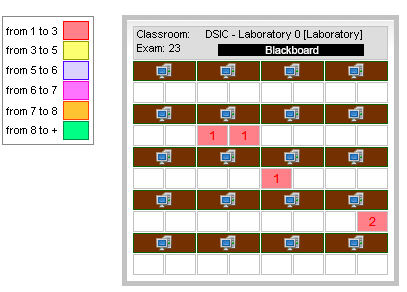
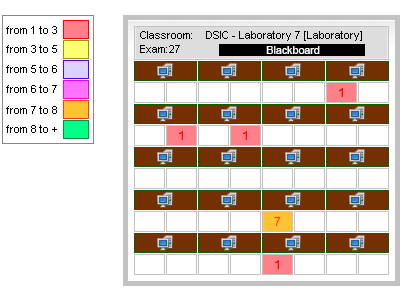
Average mark of a chair: It represents the average mark a specific chair got in a particular
exam. It was obtained by adding up the marks of all students that occupied that
chair (if the same student occupied the chair several times, their mark was also
counted several times) and then dividing the result by the number of times this chair
was occupied (hence, we get the average mark of the individual occupation of this
chair).
We can see specific examples of this in Figure 1. Observe that each chair (not each
student) is labelled with a mark. Observe also that each computer is shared by two
students in the labs. The blank chairs were never occupied by any student in any
session. Lecture halls and labs have a symmetric and proportional distribution of
chairs, thus, row 2i is twice as far to the professor as it is row i. The reader should not
extract conclusions from these figures, because they just show unprocessed data from
two examples of courses. These data (together with the rest of courses) are mixed and
statistically analyzed in results page.
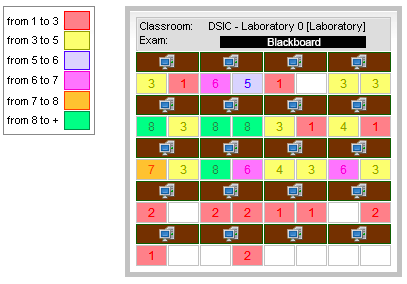
Times a chair is used: It counts the number of times that (possibly different) students
occupied the chair during the course. Figure 2 contains examples of these counters.
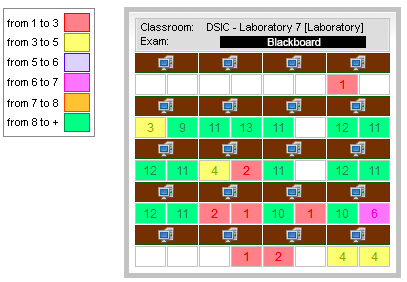
Times a chair is used by students who gave up the course: It represents the total
amount of times a chair was used by a student who gave up the course (those that did
not take the exam). Examples are shown in Figure 3.
-