PROBLEM
Figure 1 shows a rectangular steel plate that is loaded with a 100 MPa pressure acting longitudinally. Determine the deformation and the maximum value of the stress. The material properties are E = 210 GPa and Poisson's ratio = 0.3.
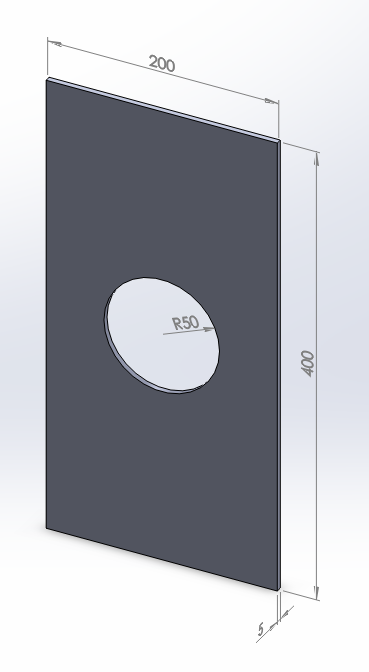
Figure 1. Plate with a circular hole.
GEOMETRY OF THE MODEL
First of all, define a name for the problem: "Plate".
Utility Menu > File > Change Title
And define the problem as "structural":
Main Menu > Preferences > Structural
To solve this particular problem, a plane element is used, that is the "SOLID 4 node 182" element (Figure 2).
Main Menu > Preprocessor > Element Type > Add/Edit/Delete
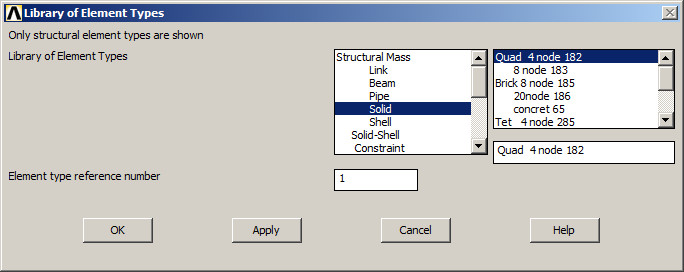
Figure 2. "SOLID 4 node 182" element.
This element type has the option to define the thickness. Click "Options" and select "Plane strs w/thk" (Plane Stress with thickness), as indicated in Figure 3.
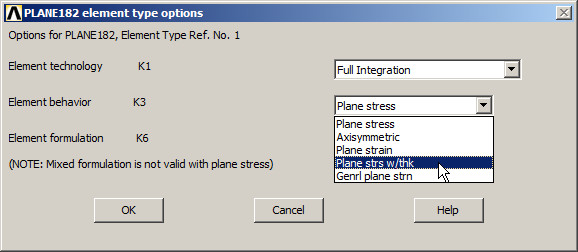
Figure 3. Stress plane with thickness.
Now, define the thickness of 5 mm (Figure 4):
Main Menu > Preprocessor > Real Constants > Add/Edit/Delete
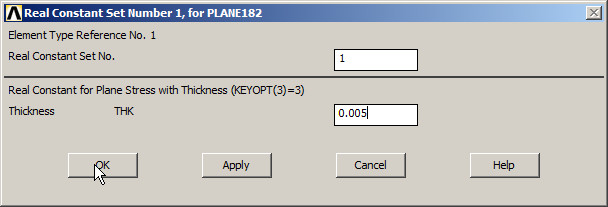
Figure 4. Defining the thickness.
After that, define the mechanical properties of the steel (Figure 5):
Main Menu > Preprocessor > Material Props > Material Models
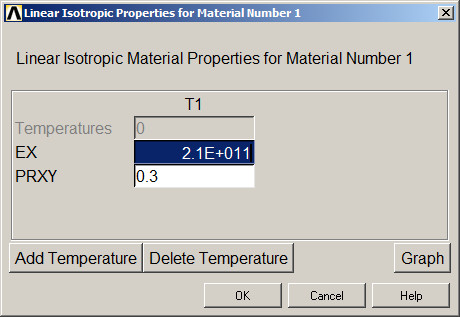
Figure 5. Mechanical properties of the steel.
Now, create the rectangular area, as indicated in Figure 6:
Main Menu > Preprocessor > Modeling > Create > Areas > Rectangle > By 2 Corners
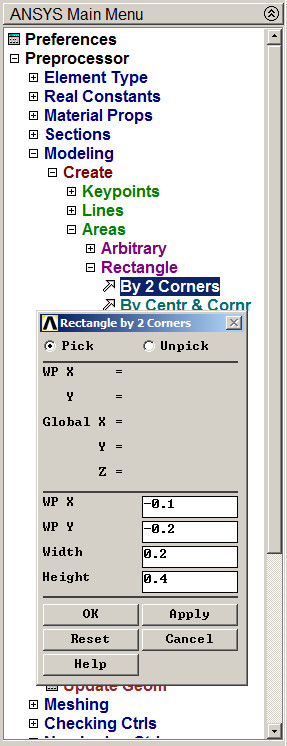
Figure 6. Rectangular area.
Now, the circular area for the hole, as indicated in Figure 7:
Main Menu > Preprocessor > Modeling > Create > Areas > Circle > Solid Circle
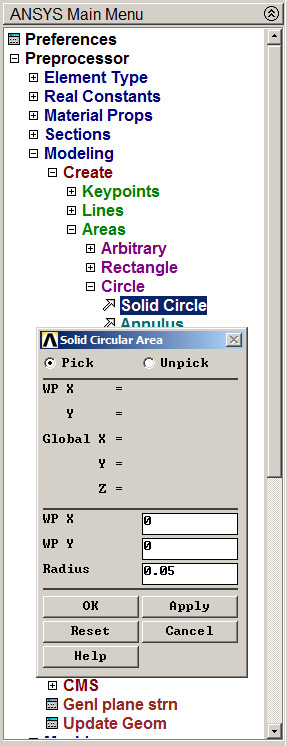
Figure 7. Circular area for the hole.
The circular area is subtracted (Figure 8):
Main Menu > Preprocessor > Modeling > Operate > Booleans > Subtract > Areas
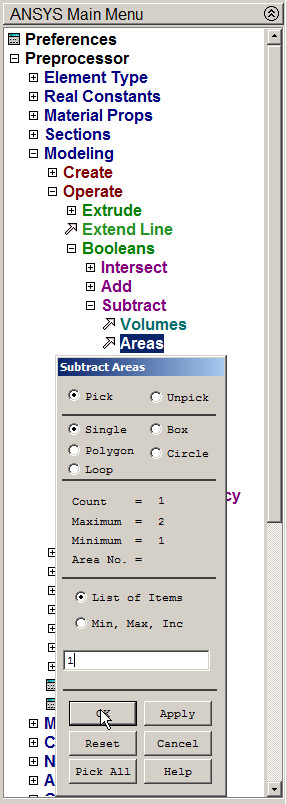
Figure 8. Subtract the circular area.
For this operation, select the rectangular area, click "OK" and then select the circular area, and "OK" again. Figure 9 represents the model after subtracting the circular area.
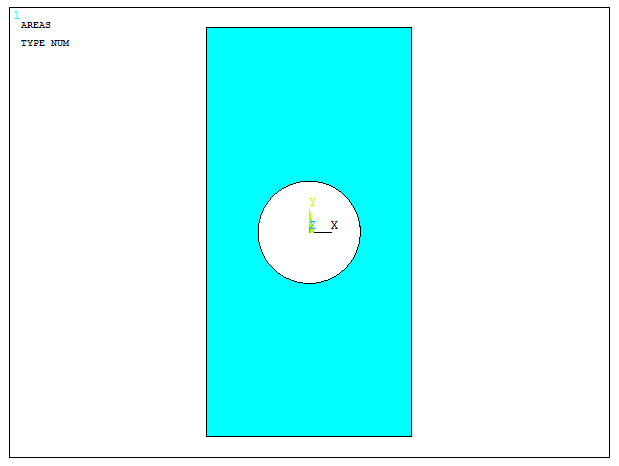
Figure 9. Model with the circular hole.
Now, define the element size, that is 5 mm (Figure 10):
Main Menu > Preprocessor > Meshing > Size Cntrls > ManualSize > Areas > All Areas
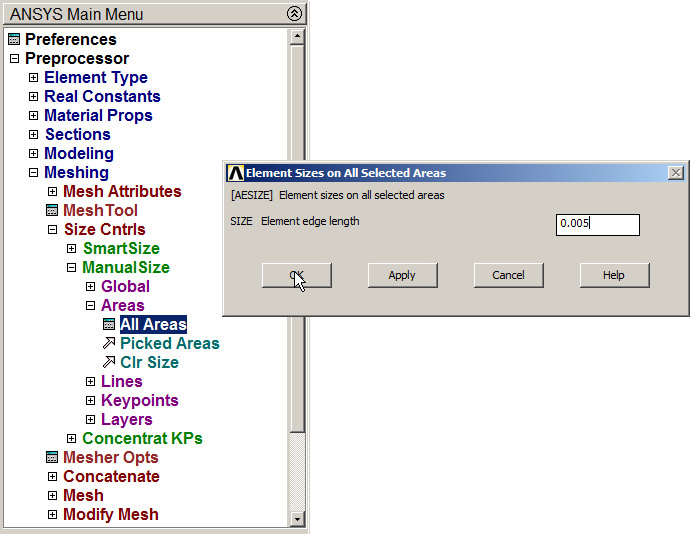
Figure 10. Defining the element size.
Finish the meshing process (Figure 11):
Main Menu > Preprocessor > Meshing > Mesh > Areas > Free

Figure 11. Meshing the model.
Figure 12 represents the meshed model.
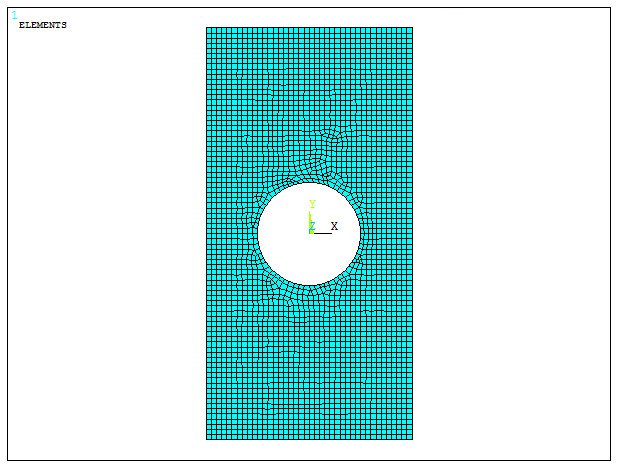
Figure 12. Meshed model.
At this time, there is a "Warning" message, that recommends an element type wih 6 or 8 nodes for this particular model (Figure 13). Accept the message.
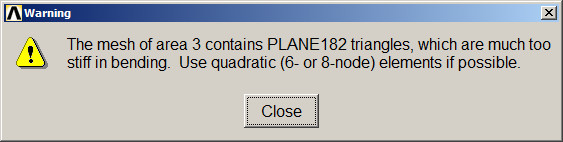
Figure 13. Warning message.
To follow this recommendation, first clear the mesh (Figure 14):
Main Menu > Preprocessor > Meshing > Clear > Areas
And click "Pick All".
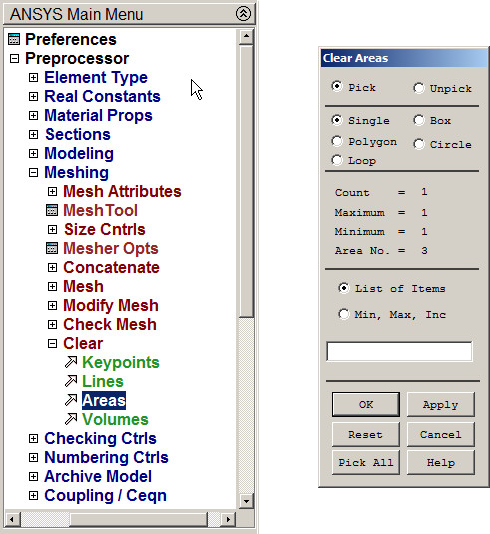
Figure 14. Clear the mesh.
Now, delete the element type:
Main Menu > Preprocessor > Element Type > Add/Edit/Delete
Click on "Delete" (Figure 15):
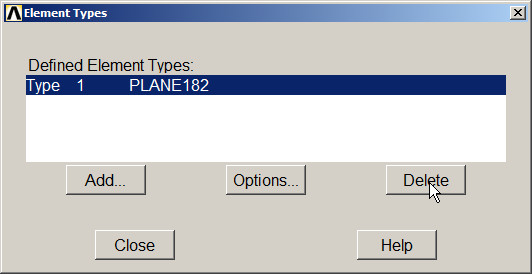
Figure 15. Delete the PLANE 182 element.
Next, select the element "SOLID 8 node 183" (Figure 16).
Main Menu > Preprocessor > Element Type > Add/Edit/Delete
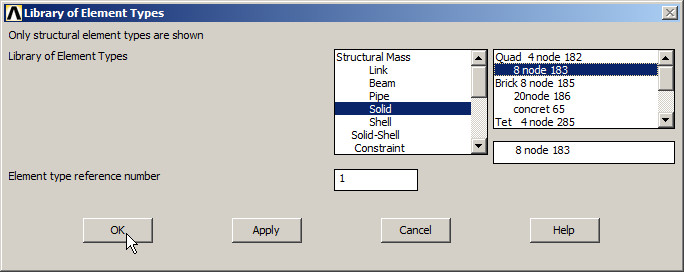
Figure 16. Defining the element PLANE 183.
As before, define the option to input the thickness (Figure 17).
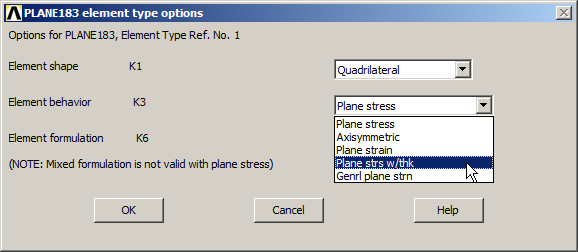
Figure 17. Plane stress with thickness.
To finish this process, mesh the area again (Figure 18):
Main Menu > Preprocessor > Meshing > Mesh > Areas > Free
This time, there is no warning message.
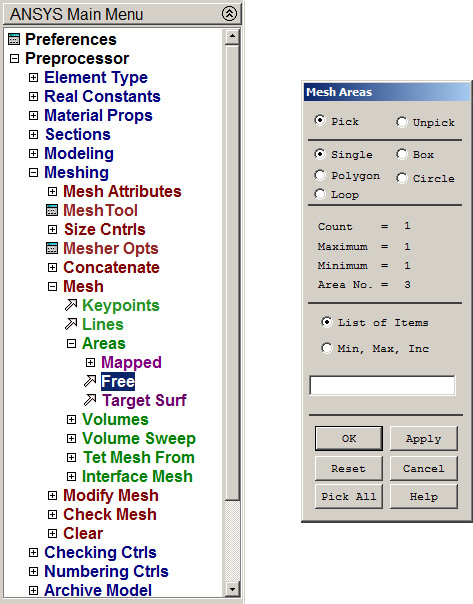
Figure 18. Mesh the area.
LOADS AND BOUNDARY CONDITIONS
For the boundary conditions, restrict the displacement in "UY" direction of the line at the top.
Main Menu > Preprocessor > Loads > Define Loads > Apply > Structural > Displacement > On Lines
Select the line and "UY", as indicated in Figure 19.
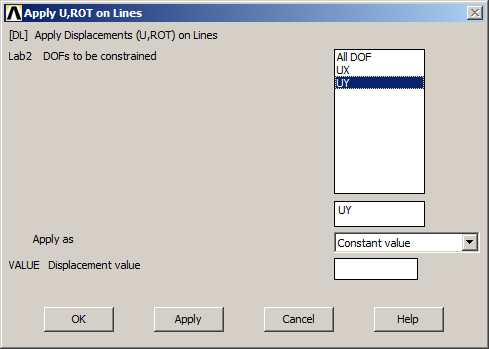
Figure 19. Restrict the line in UY direction.
Now, number the area (Figure 20):
Utility Menu > PlotCtrls > Numbering
Activate "Area numbers". And from the "Utility Menu", pick "Plot Areas".
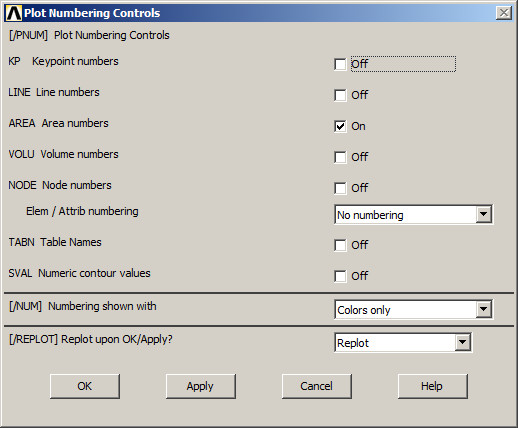
Figure 20. Plot Numbering Controls.
Now, select the top keypoint at the left and apply "All DOF" conditions (Figure 21):
Main Menu > Preprocessor > Loads > Define Loads > Apply > Structural > Displacement > On Keypoints
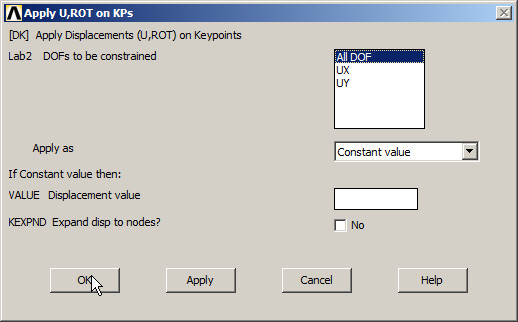
Figure 21. "All DOF" restriction.
For the load, apply the 100 MPa pressure acting on the line at the bottom:
Main Menu > Preprocessor > Loads > Define Loads > Apply > Structural > Pressure > On Lines
And define the pressure as indicated in Figure 22.
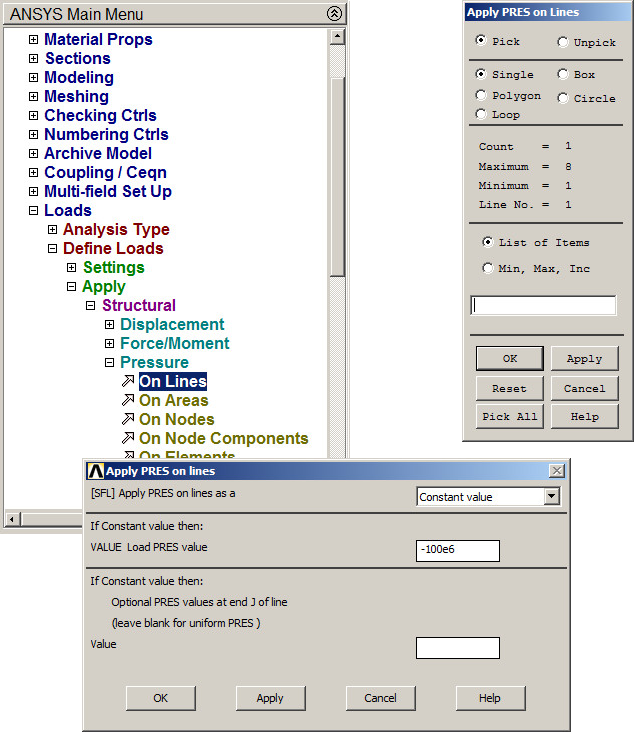
Figure 22. Pressure on the line.
From the window "Symbols" activate "Arrows" (Figure 23), to represent the pressure as a vector magnitude.
Utility Menu > PlotCtrls > Symbols
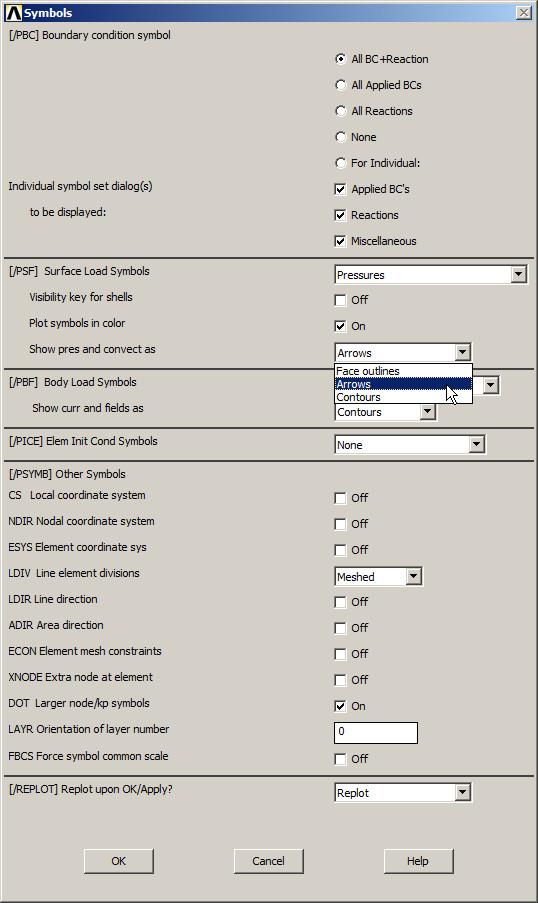
Figure 23. Symbols option.
Figure 24 represents the model with the pressure and the boundary conditions.
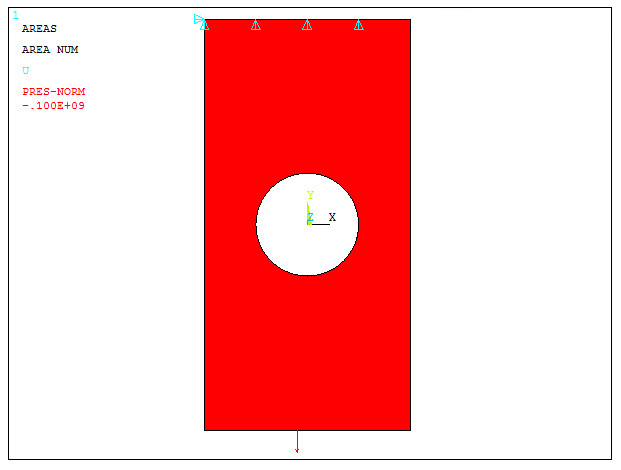
Figure 24. Model with the pressure and boundary conditions.
SOLUTION
Solve the problem.
Main Menu > Solution > Solve > Current LS
Click "OK" at "Solution is done!".
RESULTS
Figure 25 represents the deformation of the model:
Main Menu > General Postproc > Plot Results > Deformed Shape
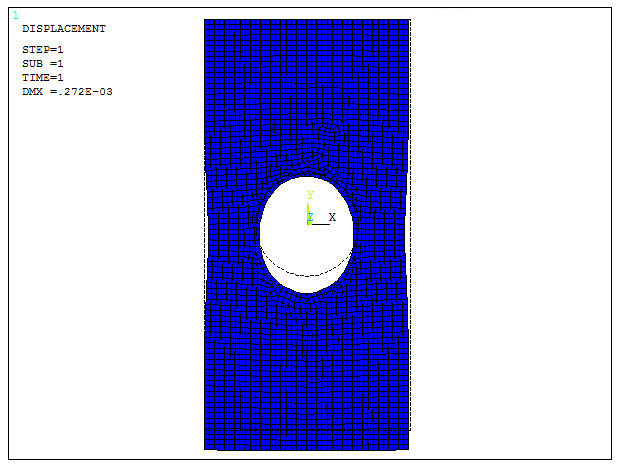
Figure 25. Deformation of the model.
Evaluate the stress distribution (Figure 26):
Main Menu > General Postproc > Plot Results > Contour Plot > Nodal Solu
And select "von Mises stress".
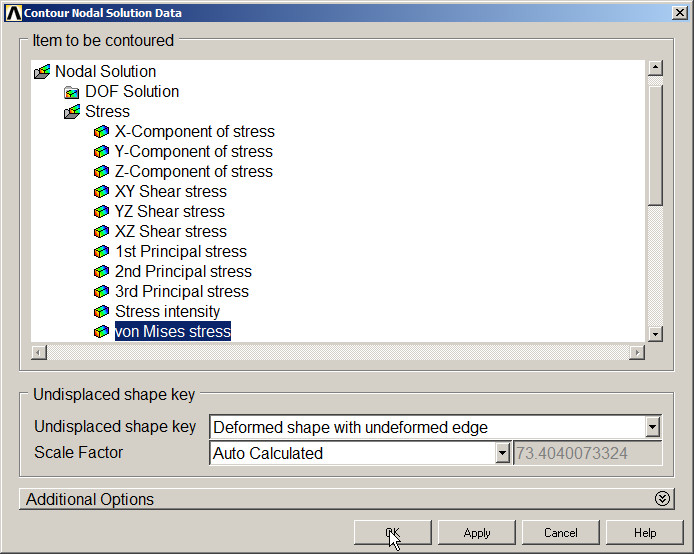
Figure 26. "von Mises stress" option.
Figure 27 represents the stress distribution in the model.
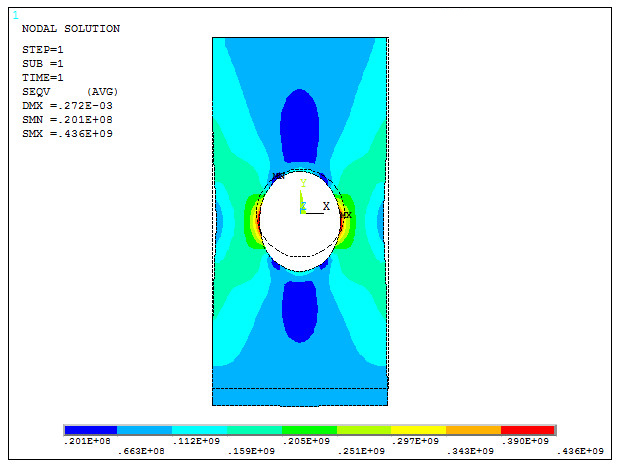
Figure 27. Stress distribution.
Finally, select the option "Deformed shape only" (Figure 28).
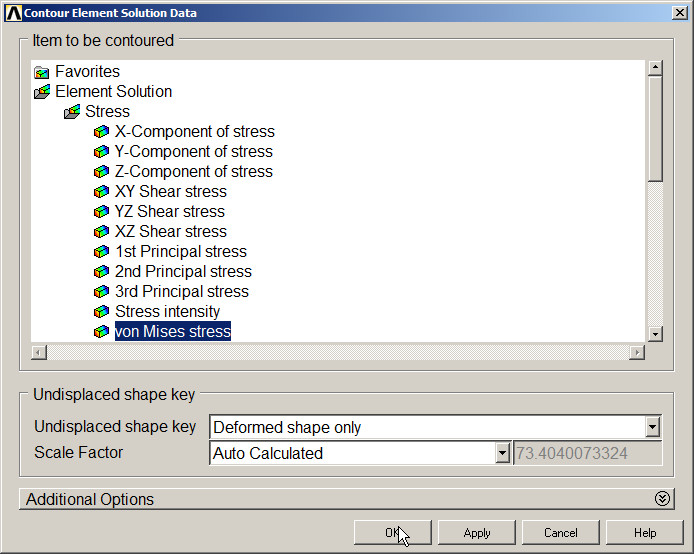
Figure 28. Stress distribution with the option "Deformed shape only".
Figure 29 shows the results.
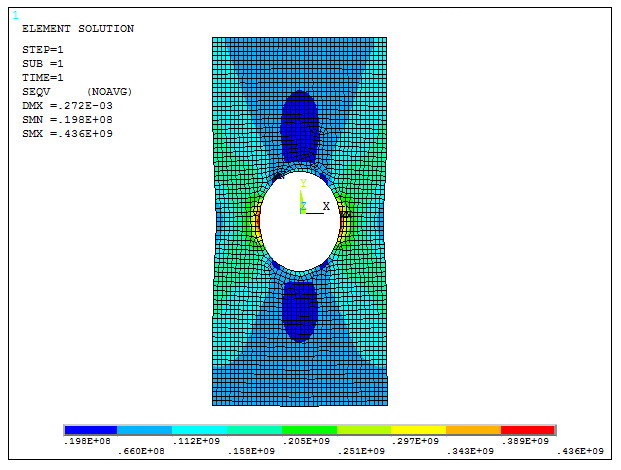
Figure 29. Results with the deformation.